Always refer to the main Pearson general guidelines and science guidance when writing alternative text for images.
When describing Physics images, keep in mind the following key aspects and examples. Not all guidance will apply to all images.
- Describe the physical principles and concepts that are relevant to the image. This may include concepts such as force, energy, momentum, or wave behavior.
- Provide quantitative information shown in the image, such as the values of relevant physical quantities (e.g., acceleration, velocity, or wavelength) and any equations or formulas.
- Follow Pearson’s authoring guidance for math-related content.
Examples
Reminder: The Mastering authoring platform has a title field and alt text field but does not have the functionality for a long description. Alternative text descriptions in Mastering may have more than 255 characters. The eText 2 authoring platform has the functionality for alt text and a long description. For more information about the different authoring systems, see Platform Authoring Information.
Example 1
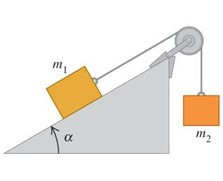
Alt Text
A block of mass m sub 1 is on an incline at angle alpha above the horizontal. This block is connected to a hanging block of mass m sub 2 by a cord passing over a pulley at the upper edge of the incline.
Example 2
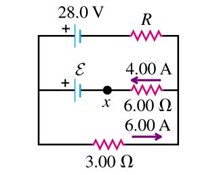
Alt Text
A circuit has 3 parallel branches oriented horizontally, with positive battery terminals on the left. Each branch has the following components listed from left to right. The top branch has a 28.0 volt battery and a resistor with resistance R. The middle branch has a battery with voltage epsilon, point x, and a 6.00 ohm resistor. A 4.00 ampere current flows to the left through the resistor. The bottom branch has a 3.00 ohm resistor. A 6.00 ampere current flows to the right from the resistor.
Example 3
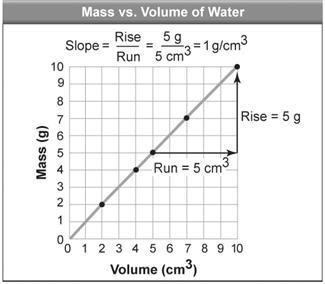
Alt Text
A graph plots mass in grams versus volume of water in cubic centimeters. The graph is a line that rises from left to right through the points (2, 2), (4, 4), (5, 5), (7, 7), and (10, 10). 2 arrows represent the run and rise of the line. The first arrow starts on the line at (5, 5) and extends rightward to (10, 5). This arrow represents run = 5 cubic centimeters. The second arrow starts at the head of the first arrow and extends upward to the line at (10, 10). This arrow represents rise = 5 grams. An equation states, slope = rise divided by run, = 5 grams divided by 5 cubic centimeters, = 1 gram per cubic centimeter.
Example 4
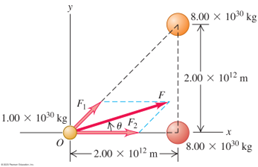
Alt Text
A free body diagram represents the total gravitational force on a star.
Long Description
(Must be marked up in HTML)
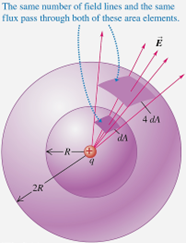
Point charge q is at the center of 2 concentric spheres. The inner sphere has radius R. The outer sphere has radius 2 R. 5 vectors E radiate from q, representing field lines. The vectors pass through the center and vertices of a square area element on the surface of each sphere. The area element on the inner sphere has area d A. The larger area element on the outer sphere has area 4 d A. Despite the difference in area, the same number of field lines and the same flux pass through each element.
Example 5
Alt Text
A diagram demonstrates the relationship between field lines and area at different distances from a point charge.
Long Description
(Must be marked up in HTML)
Point charge q is at the center of 2 concentric spheres. The inner sphere has radius R. The outer sphere has radius 2 R. 5 vectors E radiate from point charge q, representing field lines. The vectors pass through the center and vertices of a square area element on each sphere. The area element on the inner sphere has area d A. The larger area element on the outer sphere has area 4 d A. Despite the difference in area, the same number of field lines and the same flux pass through each element.
Example 6
Alt Text
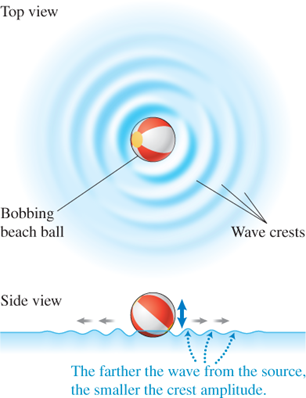
2 views of waves produced by a beach ball bobbing in water. Top view. The wave crests form concentric circles centered on the ball. Side view. As the distance from the ball increases, the amplitude of the wave crest decreases.
Example 7
Alt Text
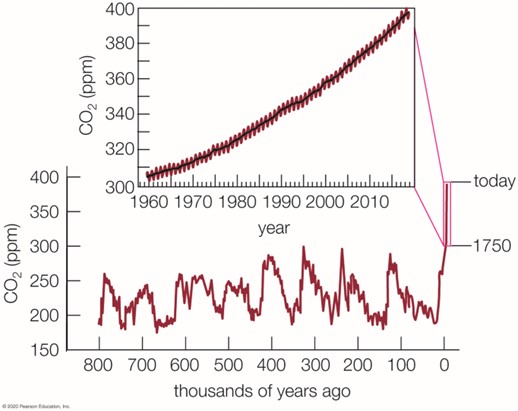
Graphs plot C O 2 in parts per million over time.
Long Description
(Must be marked up in HTML)
Over time from 800 thousand years ago to 100 thousand years ago, C O 2 in parts per million rises and falls in 100 thousand year cycles from 180 to 300, to a maximum at 325 less than one hundred thousand years ago. From 1960 to today, C O 2 in parts per million rises from 300 to 400.
Dated: 2023-12-01
