Skip to main navigation
Skip to content
Skip to footer
Requirements
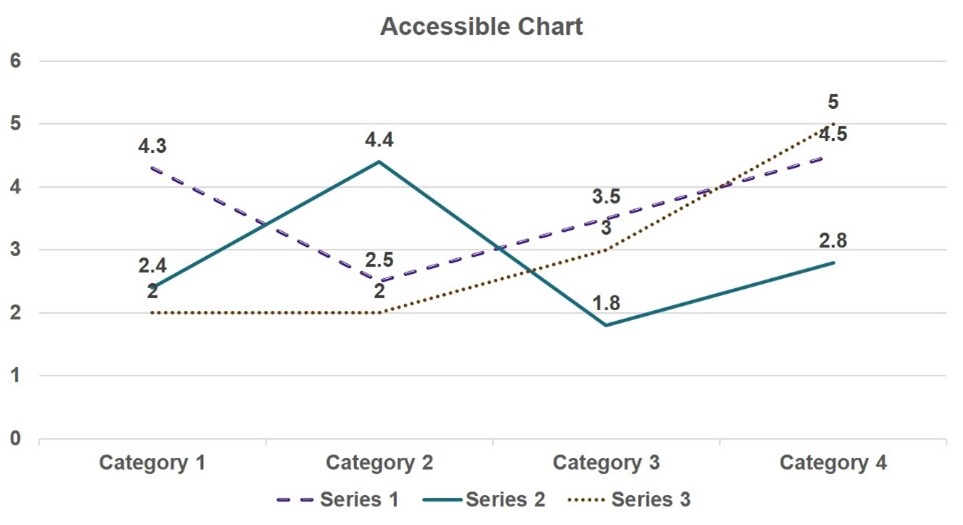
- Color is not used as the only visual means of conveying information.
- Ensure all text and images of text has a contrast ratio of at least 4.5:1.
- Meaningful non-text context has at least 3:1 against adjacent colors.
- Design charts with color blindness in mind.
- Charts must have alt text.
Important Info
- Create charts using PPTs built-in chart tools.
- Avoid using images of charts whenever possible.
- Most charts will require short and long descriptions to fully explain the image. Please see Alternative Text/Long Descriptions for Complex Images for more information.
- Make sure chart labels have sufficient contrast.
- Red/green color blindness is the most common, so avoid green on red or red on green.
Tips
- Insert a chart using the ribbon: Insert > Illustrations > Chart. This will ensure screen readers announce the chart as a chart.
- Charts that contain color may need alternative visual designs such as different line styles, patterns, or symbols.