When populating the Alt Text Template for Static Images – Excel, long descriptions must be written in valid HTML code snippets (with opening and closing tags). <div> tags are not to be used in Alfresco as they will be added downstream. You can use this tool to validate your HTML.
Headings
Headings should be applied in long descriptions if necessary to inform structure. Headings should be sequential (<h1> through <h6>) without skipping levels. You can read more about structuring headings in this article.
Paragraphs
For consistency, whether there is one paragraph or multiple ones, wrap each paragraph in a tag.
Lists
Proper list markup should be applied for the following:
- Unordered (bulleted) lists
- Ordered (numbered) lists
- Description lists
Tables
Accessible data tables
Most tables can be marked up in the narrative text to be accessible without the need for a long description of the table. In some cases, tables may have visual requirements that make it difficult to code for accessibility. Examples of this can be found in the accounting discipline, where a precise visual representation may be required for ledgers and balance sheets, and where there may be absent column heads and blank or merged cells. In these cases, or when the table is an image, it is necessary to include an accessible version of the table in the long description for the table that may be understood by users of assistive technology. The accessible versions aren’t restricted by the visual requirements of the original table, so they can be made accessible by adding a missing column and row headers and avoiding empty cells. The W3C Table Tutorials are a recommended resource. To make complex tables more accessible, you can add a <caption> element which can serve as a table title if it is visible or as a summary if it is invisible.
Simple data tables
A simple data table comprises either a single set of column headers or row headers or both column and row headers. Screen readers identify the table headers and announce them as screen reader users navigate through the data.
Required
- Opening and closing table tags <table> and </table>
- Column and row headers are inside <th> elements. Columns can be grouped with a parent column header using the <th scope=”colgroup”> elements.
- Row headers are inside <th scope=”row”> and be grouped with a parent row header using the <th scope=”rowgroup”> element.
- Do not use blank header cells. Standard cells should be left blank consistently throughout the table (I.e., don’t leave one blank and put N/A in another to communicate the same information)
- Header cells (i.e. <th>) with text abbreviations that need expansion use the title attribute with the expanded text set as the value.
Optional
- A description of the table content or a title is provided inside of the <caption> element.
Code Example
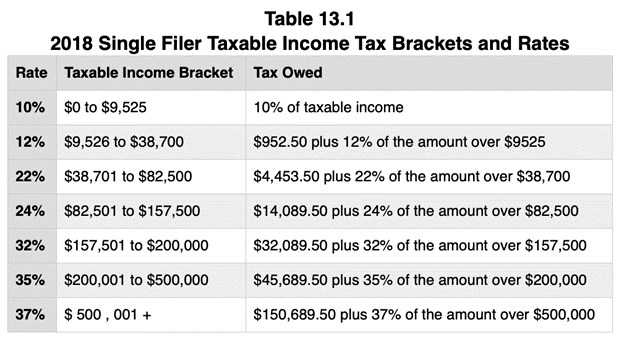
The code for the table below can be seen live on Paul Adam’s Tables Accessibility Quick Guide.
<table>
<caption>Table 13.1<br>2018 Single Filer Taxable Income Tax Brackets and Rates</caption>
<tr><th scope=”col”>Rate</th><th scope=”col”>Taxable Income Bracket</th><th scope=”col”>Tax Owed</th></tr>
<tr>
<th scope=”row”>10%</th>
<td>$0 to $9,525</td>
<td>10% of taxable income</td>
</tr>
<tr>
<th scope=”row”>12%</th>
<td>$9,526 to $38,700</td>
<td>$952.50 plus 12% of the amount over $9525</td>
</tr>
<tr>
<th scope=”row”>22%</th>
<td>$38,701 to $82,500</td>
<td>$4,453.50 plus 22% of the amount over $38,700</td>
</tr>
<tr>
<th scope=”row”>24%</th>
<td>$82,501 to $157,500</td>
<td>$14,089.50 plus 24% of the amount over $82,500</td>
</tr>
<tr>
<th scope=”row”>32%</th>
<td>$157,501 to $200,000</td>
<td>$32,089.50 plus 32% of the amount over $157,500</td>
</tr>
<tr>
<th scope=”row”>35%</th>
<td>$200,001 to $500,000</td>
<td>$45,689.50 plus 35% of the amount over $200,000</td>
</tr>
<tr>
<th scope=”row”>37%</th>
<td>$ 500, 001 +</td>
<td>$150,689.50 plus 37% of the amount over $500,000</td>
</tr>
</table>
Complex data table
A complex data table comprises of two or more sets of column headers, row headers or column and row headers, as well as data cells.
Data in a table and column format, if not coded keeping accessibility in mind, can pose accessibility issues for users with many types of disabilities, especially for those who use screen readers. Content presented using simple data tables can yet be understood but in the case of complex data tables, screen reader users often find it difficult to interpret the data.
In the case of complex tables along with <th> tags, “headers” and “id” attributes need to be specified for data cells and table header cells respectively. This helps in explicitly defining the relationship between data cells and their headers. This explicit association is helpful for screen readers in rendering the header cells when users navigate through the table data.
In order to make complex tables accessible, it is recommended to define the table caption and summary as well. Alternatively, complex tables can be made accessible by breaking them into multiple simple data tables.
Requirements
- Follow requirements for simple data tables
- Use “id” and “headers” attributes for tables with multiple row and column headers to associate the column header with the data cells
- Use “rowspan” and “colspan” with tables with merged columns and rows
- Include a table summary
Option 1 – add summary using aria-describedby
Option 2 – add summary in the table’s <caption> as long as the summary is brief
Option 3 – add the table in a <figure> and put the title and summary in the <figcaption>
Code Example
<table>
<caption>
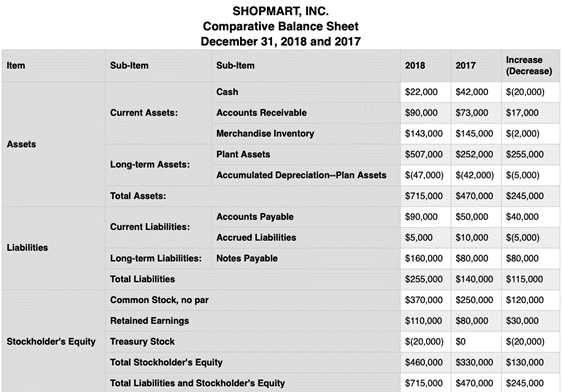
SHOPMART, INC.<br>
Comparative Balance Sheet<br>
December 31, 2018 and 2017
</caption>
<tr><th scope=”col”>Item</th><th scope=”col”>Sub-Item</th><th scope=”col”>Sub-Item</th><th scope=”col”>2018</th
<th scope=”col”>2017</th><th scope=”col”>Increase<br>(Decrease)</th></tr>
<tr><th scope=”rowgroup” rowspan=”6″>Assets</th><th scope=”rowgroup” rowspan=”3″>Current Assets:</th><th scope=”row”>Cash</th><td>$22,000</td><td>$42,000</td><td>$(20,000) </td></tr>
<tr><th scope=”row”>Accounts Receivable</th><td>$90,000</td><td>$73,000</td><td>$17,000</td></tr>
<tr><th scope=”row”>Merchandise Inventory</th><td>$143,000</td><td>$145,000</td><td>$(2,000) </td></tr>
<tr><th scope=”rowgroup” rowspan=”2″>Long-term Assets:</th><th scope=”row”>Plant Assets</th><td>$507,000</td
<td>$252,000</td><td>$255,000</td></tr>
<tr><th scope=”row”>Accumulated Depreciation–Plan Assets</th><td>$(47,000) </td><td>$(42,000) </td><td>$(5,000
</td></tr>
<tr><th scope=”row” colspan=”2″>Total Assets:</th><td>$715,000</td><td>$470,000</td><td>$245,000</td></tr>
<tr><th scope=”rowgroup” rowspan=”4″>Liabilities</th><th scope=”rowgroup” rowspan=”2″>Current Liabilities:</th><th scope=”row”>Accounts Payable</th><td>$90,000</td><td>$50,000</td><td>$40,000</td></tr>
<tr><th scope=”row”>Accrued Liabilities</th><td>$5,000</td><td>$10,000</td><td>$(5,000) </td></tr>
<tr><th scope=”rowgroup” rowspan=”1″>Long-term Liabilities:</th><th scope=”row”>Notes Payable</th
<td>$160,000</td><td>$80,000</td><td>$80,000</td></tr>
<tr><th scope=”row” colspan=”2″>Total Liabilities</th><td>$255,000</td><td>$140,000</td><td>$115,000</td></tr>
<tr><th scope=”rowgroup” rowspan=”5″>Stockholder’s Equity</th><th scope=”row” colspan=”2″>Common Stock, no par</th><td>$370,000</td><td>$250,000</td><td>$120,000</td></tr>
<tr><th scope=”row” colspan=”2″>Retained Earnings</th><td>$110,000</td><td>$80,000</td><td>$30,000</td></tr>
<tr><th scope=”row” colspan=”2″>Treasury Stock</th><td>$(20,000)</td><td>$0</td><td>$(20,000)</td></tr>
<tr><th scope=”row” colspan=”2″>Total Stockholder’s Equity</th><td>$460,000</td><td>$330,000</td><td>$130,000</td
</tr>
<tr><th scope=”row” colspan=”2″>Total Liabilities and Stockholder’s Equity</th><td>$715,000</td><td>$470,000</td
<td>$245,000</td></tr>
</table>
MathML
Mathematical Markup Language, or MathML, is used to render and convey mathematical equations and notations properly to assistive technologies. For example, when MathML is used to construct the equation 1 x 2 = 2, a screen reader will say “one times 2 equals 2” as opposed to “one X [as in the letter ‘X’] two equals two”.
MathML is currently supported natively in Firefox. For Chrome to support MathML, MathJax, which is a JavaScript display engine, will need to be referenced in the code. To add MathJax, copy and paste the following in the element of the HTML code:
<script src=”https://polyfill.io/v3/polyfill.min.js?features=es6″></script>
<script id=”MathJax-script” async src=”https://cdn.jsdelivr.net/npm/mathjax@3/es5/tex-mml-chtml.js”></script>
Within the top-level <math> tag, there are several MathML elements that can be used to write mathematical equations. Some of the most common elements that are used are:
- Number <mn>,
- Operator <mo>,
- Identifier <mi>,
- Fraction <mfrac>,
- Subscript <msub>,
- Superscript <msup>.
The tag <mrow> is also commonly used to group expressions.
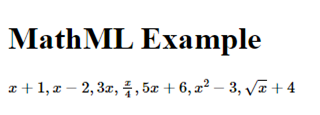
Code Example
<head>
<title>MathML Example</title>
<script src=”https://polyfill.io/v3/polyfill.min.js?features=es6″></script>
<script id=”MathJax-script” async src=”https://cdn.jsdelivr.net/npm/mathjax@3/es5/tex-mml-chtml.js”></script>
</head>
<body>
<h1>MathML Example</h1>
<math xmlns=”http://www.w3.org/1998/Math/MathML”>
<mrow>
<mi>x</mi>
<mo>+</mo>
<mn>1</mn>
<mo>,</mo>
</mrow>
<mrow>
<mi>x</mi>
<mo>−</mo>
<mn>2</mn>
<mo>,</mo>
</mrow>
<mrow>
<mn>3</mn>
<mi>x</mi>
<mo>,</mo>
</mrow>
<mrow>
<mfrac>
<mi>x</mi>
<mn>4</mn>
</mfrac>
<mo>,</mo>
</mrow>
<mrow>
<mn>5</mn>
<mi>x</mi>
<mo>+</mo>
<mn>6</mn>
<mo>,</mo>
</mrow>
<mrow>
<msup>
<mi>x</mi>
<mn>2</mn>
</msup>
<mo>−</mo>
<mn>3</mn>
<mo>,</mo>
</mrow>
<mrow>
<msqrt>
<mi>x</mi>
</msqrt>
<mo>+</mo>
<mn>4</mn>
</mrow>
</math>
</body>
MathML in Tables
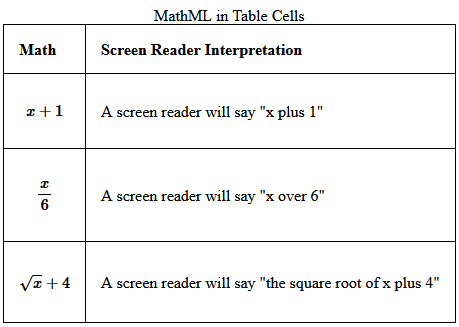
MathML is coded in an HTML table in the same manner it is coded in the body of an HTML document. The only difference is that the MathML will be nested inside the <td> elements starting with the <math> tag. When creating HTML tables, even when using MathML, it is important that the table header cells are associated with their corresponding data cells.
Code Example
<head>
<title>Using MathML in Tables</title>
<script src=”https://polyfill.io/v3/polyfill.min.js?features=es6″></script>
<script id=”MathJax-script” async src=”https://cdn.jsdelivr.net/npm/mathjax@3/es5/tex-mml-chtml.js”></script>
</head>
<body>
<table>
<caption>MathML in Table Cells</caption>
<tbody>
<tr>
<th scope=”col”>Math</th>
<th scope=”col”>Screen Reader Interpretation</th>
</tr>
<tr>
<td>
<math display=”block” xmlns=”http://www.w3.org/1998/Math/MathML”>
<mrow>
<mi>x</mi>
<mo>+</mo>
<mn>1</mn>
</mrow>
</math>
</td>
<td>A screen reader will say “x plus 1″</td>
</tr>
<tr>
<td>
<math display=”block” xmlns=”http://www.w3.org/1998/Math/MathML”>
<mrow>
<mfrac>
<mi>x</mi>
<mn>6</mn>
</mfrac>
</mrow>
</math>
</td>
<td>A screen reader will say “x over 6″</td>
</tr>
<tr>
<td>
<math display=”block” xmlns=”http://www.w3.org/1998/Math/MathML”>
<mrow>
<mn>3</mn>
<mi>x</mi>
<mo>+</mo>
<mn>5</mn>
</mrow>
</math>
<td>A screen reader will say “3 x plus 5″</td>
</tr>
</tbody>
</body>
Dated: 2023-12-01