Always refer to the main Pearson general guidelines and science guidance when writing alternative text for images.
When describing Biology images, keep in mind the following key aspects and examples. Not all guidance will apply to all images.
- Identify key elements in the image such as molecules, organelles, cells, tissues, etc. Use the terminology from the main text to describe the structures.
- Include in-image labels or legends that provide information about what the image represents.
- When relevant for understanding, identify the type of image.
- Describe the image in the context of the biological process or system it represents. Describe the meanings of arrows and the meaning conveyed by the spatial arrangement of elements in the process or system.
- Describe the size, shape, color, and texture of the key elements if that information is relevant to the image’s meaning or purpose.
Examples
Reminder: The Mastering authoring platform has a title field and alt text field but does not have the functionality for a long description. Alternative text descriptions in Mastering may have more than 255 characters. The eText 2 authoring platform has the functionality for alt text and a long description. For more information about the different authoring systems, see Platform Authoring Information.
Example 1
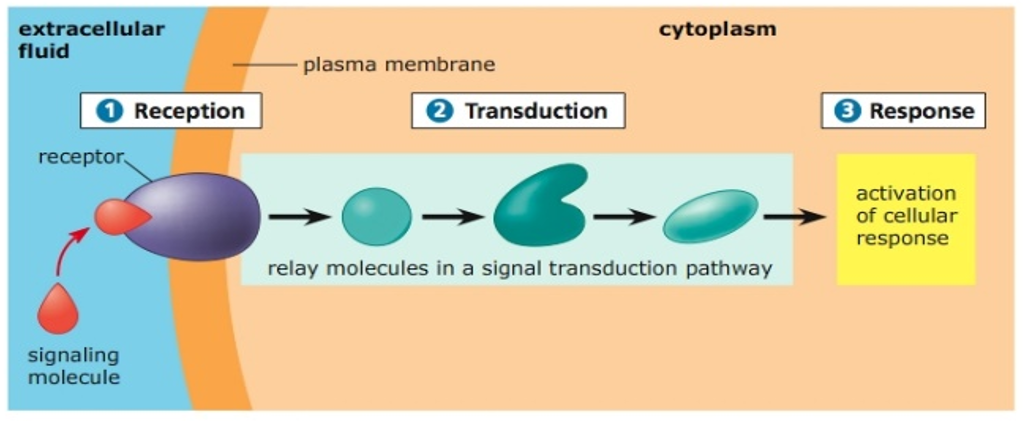
Alt Text
A general cell signaling pathway. The cytoplasm is separated from the extracellular fluid by a plasma membrane. The general cell signaling pathway includes the following 3 steps. Step 1. Reception. A receptor on the membrane interacts with a signaling molecule. Step 2. Transduction. The receptor conducts the signal to relay molecules inside the cytoplasm, which transmit the signal. Step 3. Response. Activation of cellular response takes place.
Example 2
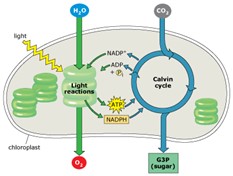
Alt Text
A diagram represents light reactions and the Calvin cycle in a chloroplast. Light reactions occur in thylakoids. These reactions depend on light and H 2 O from outside the chloroplast, as well as N A D P plus, A D P, and inorganic phosphorus produced by the Calvin cycle. Light reactions produce O 2, which exits the chloroplast. Light reactions also yield A T P and N A D P H. The Calvin cycle occurs in the stroma. It depends on C O 2 from outside the chloroplast, as well as A T P and N A D P H from light reactions. The Calvin cycle produces G 3 P, sugar, which exists the chloroplast.
Example 3
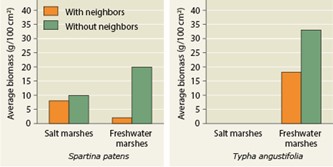
Alt Text
Two bar graphs show the average biomass in grams per 100 square centimeters for 2 marsh plants, based on marsh type and presence of neighbors. The data for the first plant, Spartina patens, is as follows. Marsh type, saltwater. With neighbors, 7 grams. Without neighbors, 10 grams. Marsh type, freshwater. With neighbors, 2 grams. Without neighbors, 20 grams. The data for the second plant, Typha angustifolia, is as follows. Marsh type, saltwater. With neighbors, 0 grams. Without neighbors, 0 grams. Marsh type, freshwater. With neighbors, 18 grams. Without neighbors, 33 grams.
Example 4
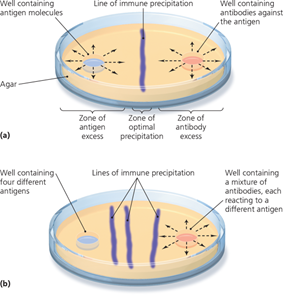
Alt Text
A diagram illustrates the process of immunodiffusion.
Long Description
(Must be marked up in HTML)
The diagram has 2 parts labeled, A, and B. Each part shows a Petri dish with agar. There are 2 wells on opposite sides of the dish. 1 well contains antigen molecules. The other well contains antibodies against the antigen molecules.
Part A. In the Petri dish, the antigen well contains a single type of antigen. The antibody well contains antibodies against that antigen. At the center of the dish, a line of immune precipitation forms in a narrow zone of optimal precipitation. The line is equal distances from the wells. The antigen well is centered in the zone of antigen excess, and the antibody well is centered in the zone of antibody excess.
Part B. In the Petri dish, the antigen well contains 4 different antigens. The antibody well contains a mixture of antibodies, each reacting to a different antigen. 3 roughly parallel lines of immune precipitation form between the wells. 2 lines are closer to the antigen well. 1 line is closer to the antibody well.
Example 5
Alt Text
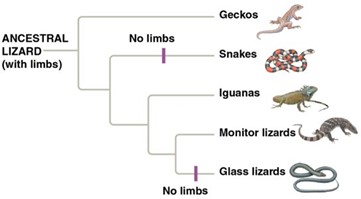
A phylogenetic tree for the evolution of lizards, snakes, geckos, and iguanas from an ancestral lizard with limbs.
Long Description
(Must be marked up in HTML)
The tree is as follows.
- The root, ancestral lizard with limbs, leads to node 1.
- Node 1 branches to geckos and node 2.
- Node 2 branches to snakes and node 3. The snake branch has a single hatch mark labeled no limbs.
- Node 3 branches to iguanas and node 4.
- Node 4 branches to monitor lizards and glass lizards. The glass lizards branch has a hatch mark labeled no limbs.
Example 6
Alt Text
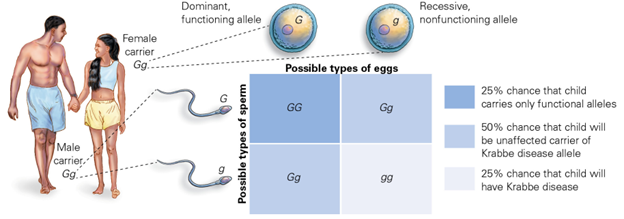
A diagram with a Punnett square shows the chances of a child developing Krabbe disease if each parent has a recessive, nonfunctioning allele.
Long Description
(Must be marked up in HTML)
In the diagram, a male carrier and a female carrier each have a dominant, functioning allele and a recessive, nonfunctioning allele. The dominant, functioning allele is represented by uppercase G. The recessive, nonfunctioning allele is represented by lowercase g.
A Punnett square demonstrates how these alleles might combine through the sperm and egg. The Punnett square is a 2 by 2 array of boxes. Rows 1 and 2 are for uppercase G and lowercase g in the sperm. Columns 1 and 2 are for uppercase G and lowercase g in the egg. As described in the following list, the entries in the Punnett square show all possible combinations of the alleles in the child, along with the probability of developing Krabbe disease.
- Top left box: uppercase G, uppercase G. The child has a 25% chance of carrying only functional alleles.
- Top right box and bottom left box: uppercase G, lowercase g. The child has a 50% chance of being an unaffected carrier of the Krabbe disease allele.
- Bottom right box: lowercase g, lowercase g. The child has a 25% chance of developing Krabbe disease.
Example 7
Alt Text
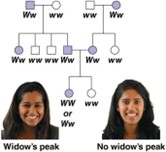
A pedigree shows the occurance of widow’s peak in 3 generations of a family.
Long Description
(Must be marked up in HTML)
A widow’s peak is a downward point in the center of the hairline, and it is caused by a dominant allele. In the diagram, the dominant allele is represented by uppercase W, and the recessive allele is represented by lowercase w. Squares and circles represent individual family members. Each shape is labeled with a pair of alleles. If at least 1 of the alleles is dominant, the shape is shaded.
The first generation consists of 2 pairs of parents represented by the following symbols.
- First pair. Shaded square with uppercase W lowercase w. Unshaded circle with lowercase w lowercase w.
- Second pair. Unshaded square with lowercase w lowercase w. Shaded circle with uppercase W lowercase w.
In the second generation, 2 individuals with different parents pair and have children. This couple is represented by the following symbols.
- First parent. Shaded square with uppercase W lowercase w.
- Second parent. Shaded circle with uppercase W lowercase w.
These parents produce 2 children who form the third generation. The children are represented by the following symbols.
- First child. Shaded circle with uppercase W uppercase W or uppercase W lowercase w. This child is a female with a widow’s peak.
- Second child. Unshaded circle with lowercase w lowercase w. This child is a female without a widow’s peak.
Dated: 2023-12-01
