Always refer to the main Pearson general guidelines and science guidance when writing alternative text for images.
When describing Astronomy images, keep in mind the following key aspects and examples. Not all guidance will apply to all images.
Identify the celestial objects that are visible in the image. These could include stars, galaxies, nebulae, planets, and other astronomical phenomena.
- Describe meaningful visual characteristics of celestial objects. The relevance of visual characteristics depends on context. Examples: color, brightness, shape, size, and texture.
- If relevant, provide the locations or relative positions of objects in the image. For example, you could describe the distance in light-years from Earth to a particular star, or you could describe the location of the star in a constellation or galaxy.
- Include any notable features or labels presented in the image.
Reminder: The Mastering authoring platform has a title field and alt text field but does not have the functionality for a long description. Alternative text descriptions in Mastering may have more than 255 characters. The eText 2 authoring platform has the functionality for alt text and a long description. For more information about the different authoring systems, see Platform Authoring Information.
Examples
Example 1

Alt Text
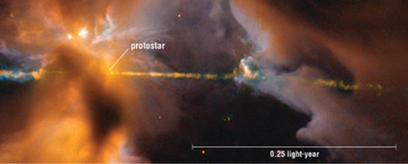
A protostar with surrounding gas and other far objects.
Long Description
(Must be marked up in HTML)
A protostar appears as a small bright dot near the center of a band of glowing gas. The band of gas has a length of about 0.6 light years. The width of the band approximately equals the diameter of the protostar.
Example 2

Alt Text
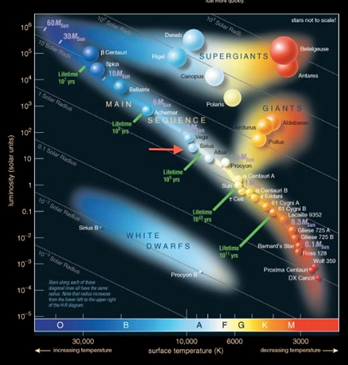
An H-R diagram for different star types.
Long Description
(Must be marked up in HTML)
The diagram plots luminosity versus surface temperature for stars of different types. The horizontal axis represents surface temperature in kelvins on a logarithmic scale, with values decreasing from left to right. The vertical axis represents luminosity in solar units on a logarithmic scale, with values increasing from bottom to top. The spectral types of stars are labeled on the horizontal axis from left to right, as described in the following table:
| Spectral Type | Temperature range in kelvins |
|---|---|
| O | Greater than 30,000 |
| B | 30,000 to 10,000 |
| A | 10,000 to 7,500 |
| F | 7,500 to 6,000 |
| G | 6,000 to 5,000 |
| K | 5,000 to 3,500 |
| M | Less than 3,500 |
Most stars are in the Main Sequence. The Main Sequence forms a downward diagonal band that falls from around 30,000 kelvins and 10 to the fifth power solar units to around 3,000 kelvins and 10 to the negative third power solar units. Siris is located near the middle of the Main Sequence. It has a temperature of about 10,000 kelvins and a luminosity of about 30 solar units.
Example 3

Alt Text
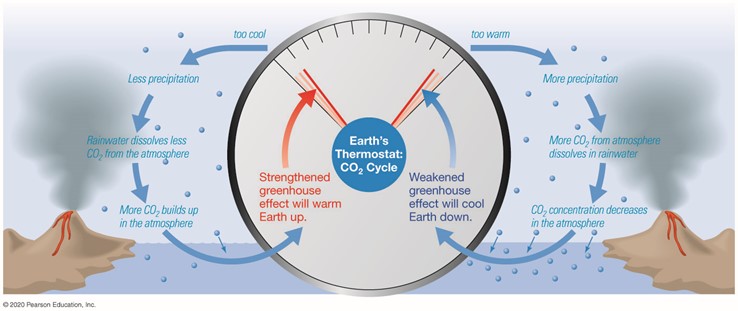
The C O 2 cycle acts as Earth’s thermostat.
Long Description
(Must be marked up in HTML)
Temperature influences atmospheric C O 2 levels and the greenhouse effect. When it’s too warm, more precipitation results in more C O 2 from the atmosphere dissolving in rainwater. The atmospheric C O 2 concentration then decreases in the atmosphere, and the weakened greenhouse effectcools Earth down. When it’s too cool, less precipitation results in rainwater dissolving less C O 2 in the atmosphere. Atmospheric C O 2 builds up, and the strengthened greenhouse effect warms Earth up.
Dated: 2023-12-01
